Day 12 Review: hierarchical multilevel models
June 18th, 2026
In-class activity
A study was designed to determine the effect on the incidence of root rot, of variety of wheat, kinds of dust for seed treatment, method of application of the dust, and efficacy of soil inoculation with the root-rot organism. We have a data frame with 160 observations on the following 8 variables that describe a designed experiment:
rowrow: equivalent to “longitude” in the field coordinatescolcolumn: equivalent to “latitude” in the field coordinatesyieldyield: response variableinocinoculate: indicator whether soil was inoculated with root rot or not
gengenotypedrydry/wet dust applicationdustdust treatmentblockblock: the field was divided in 4 equally-sized subsections that showed approximately similar characteristics.
url <- "https://raw.githubusercontent.com/stat720/summer2026/refs/heads/main/data/data_inclass_06182026.csv"
df <- read.csv(url)
12.1 Exercises
12.1.1 Data structure
- Draw a figure of the structure in the data. Do not consider the treatments yet.
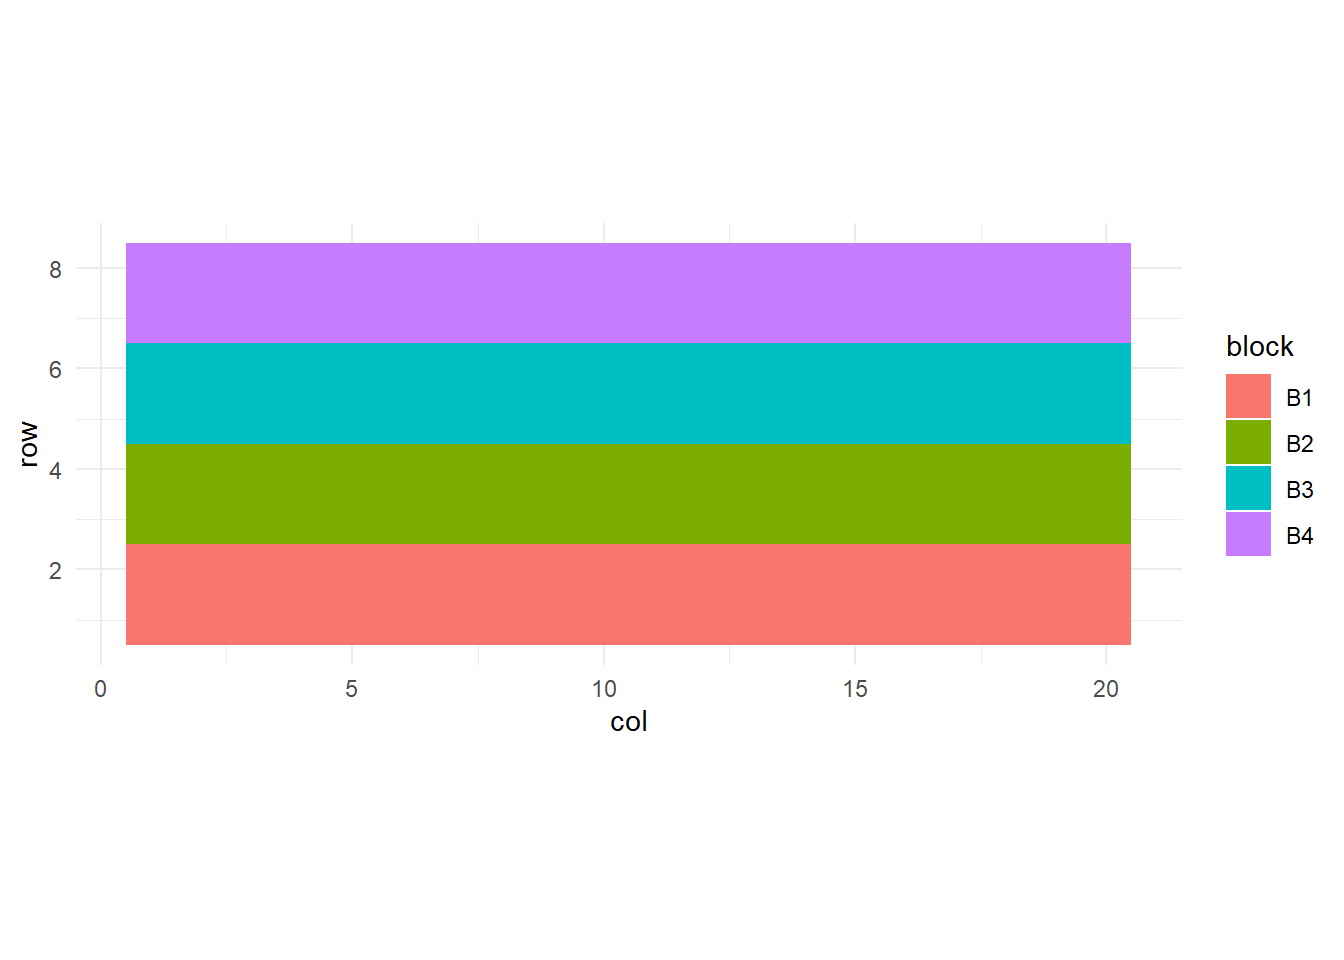
df |>
  filter(block == "B1") |>
  ggplot(aes(col, row))+
  geom_tile(aes(fill = gen), color = "black")+
  coord_fixed()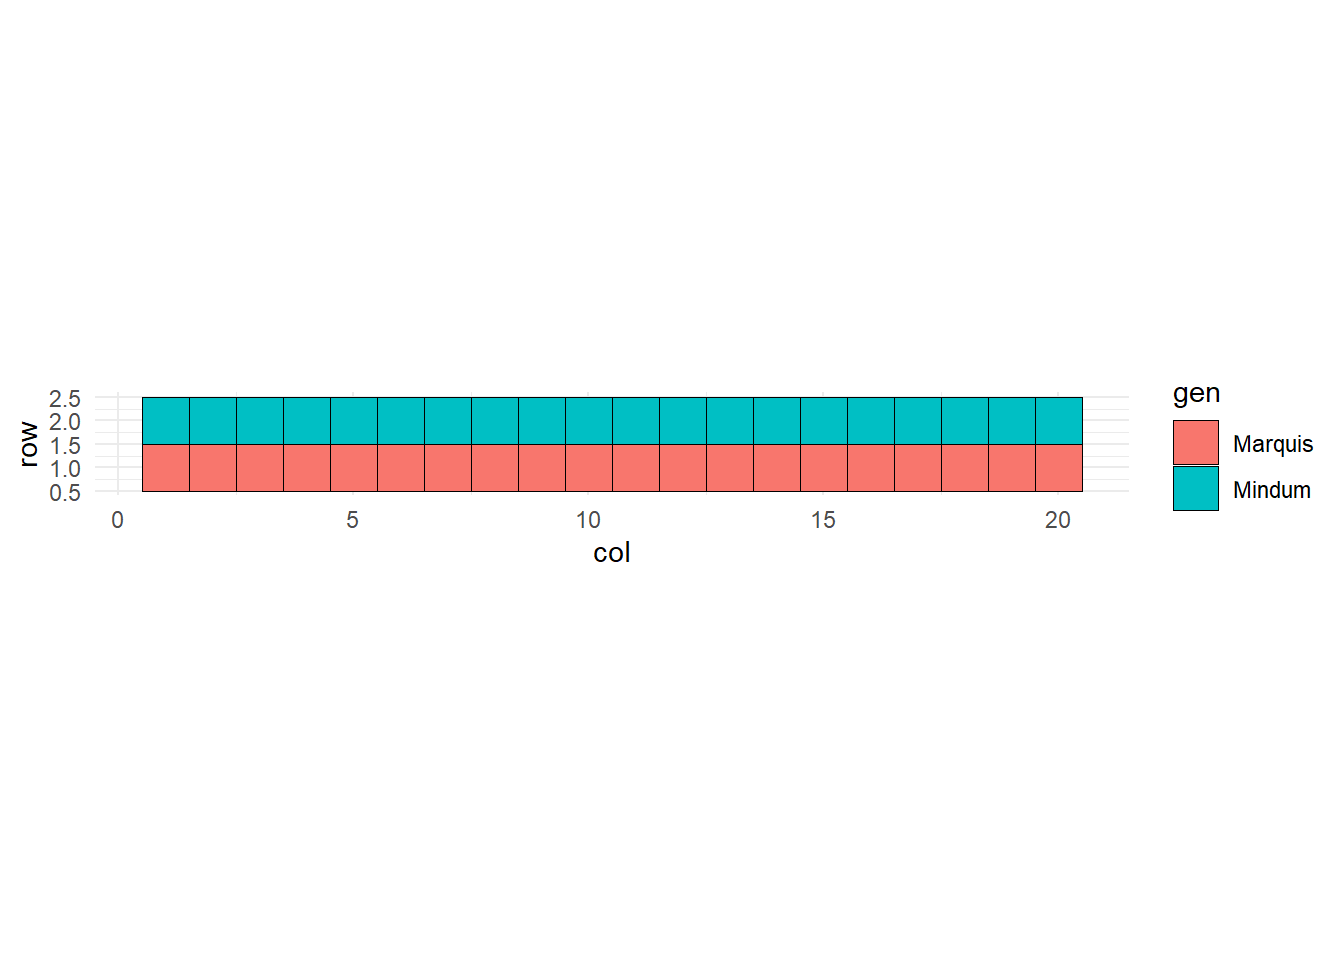
df |>
  filter(block == "B1", gen == "Mindum") |>
  ggplot(aes(col, row))+
  geom_tile(aes(fill = paste(dust, dry)), color = "black")+
  geom_point(aes(fill = inoc), shape =21, size = 3)+
  coord_fixed()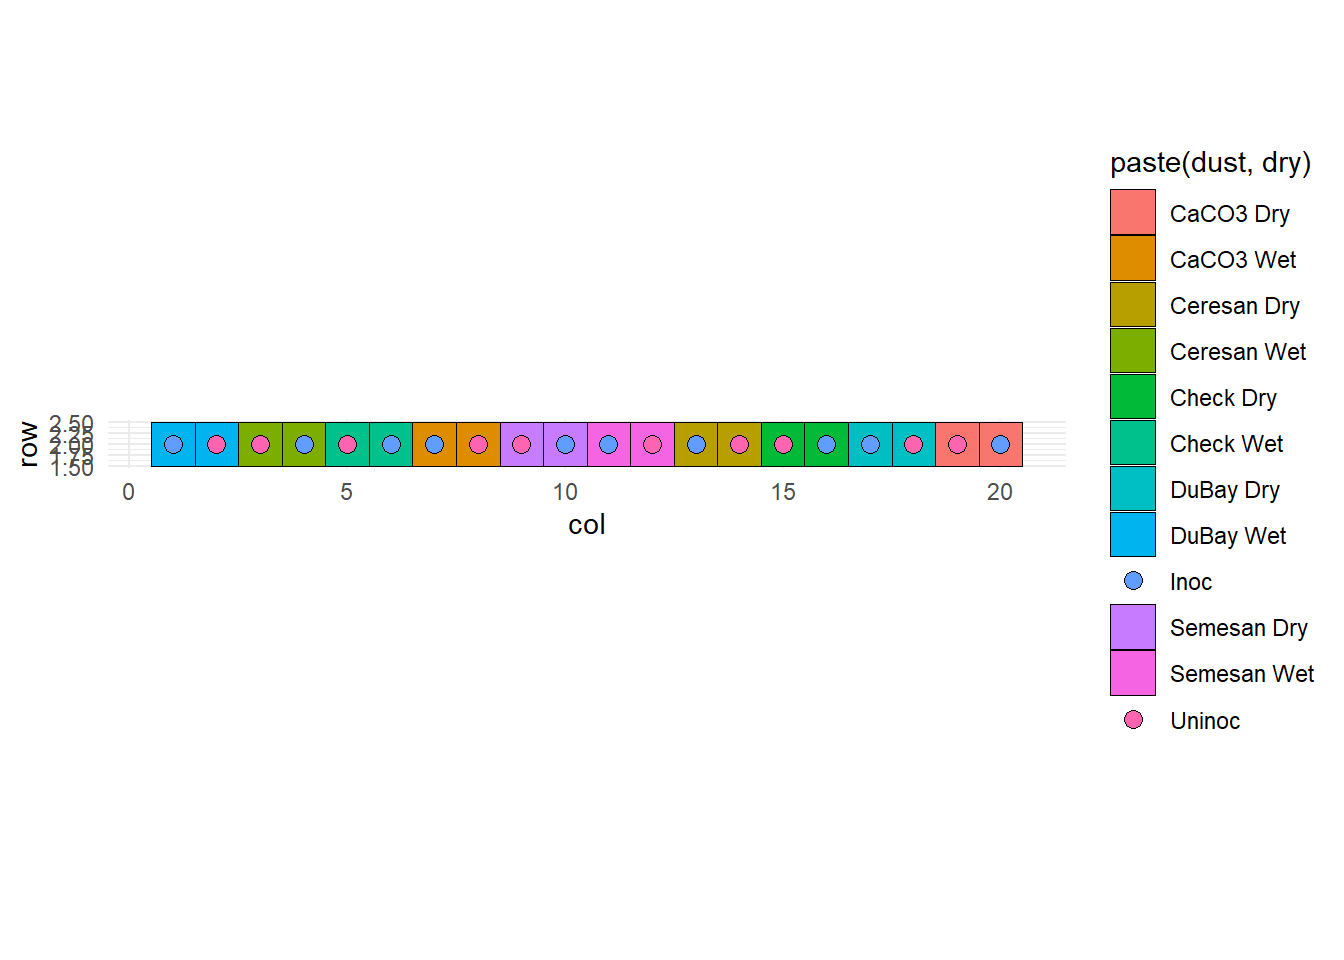
12.1.2 Designed experiment
2a. Draw a figure of the different randomization steps. 2b. Indicate the experimental units for the different treatment factors. 2c. How many observations do you have for each treatment factor? 2d. What are the treatment structure and the design structure?
12.2 Acknowledgements
- Data come from the
agridatpackage.