Day 20 Power analysis
July 9th, 2025
20.1 Announcements
- Today is Argentina’s independence day!
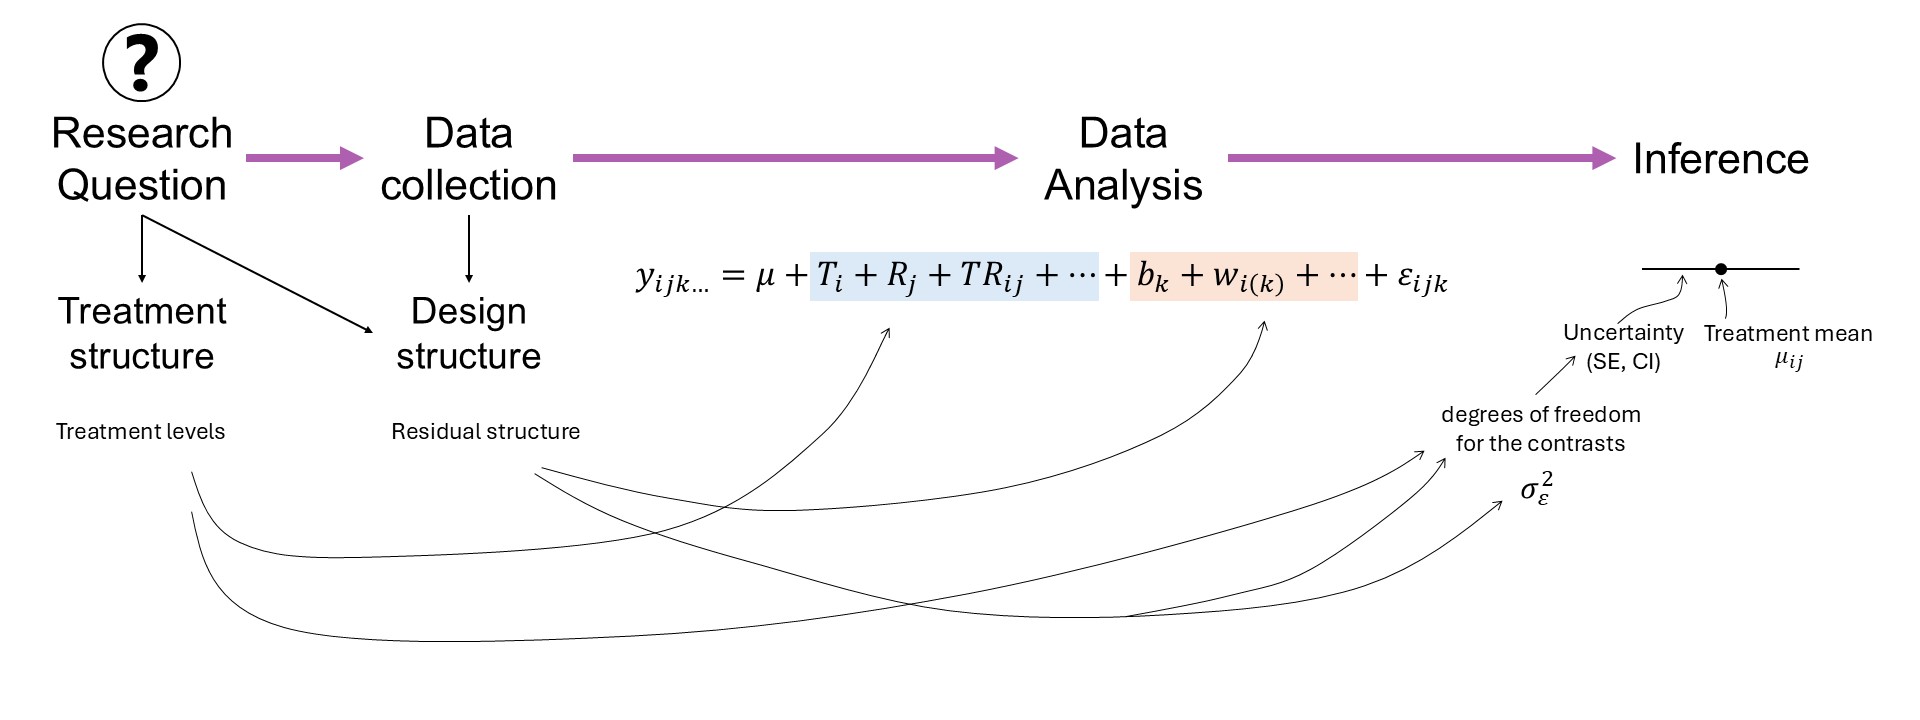
20.3 Power of an experiment
Let’s first review the different types of errors:
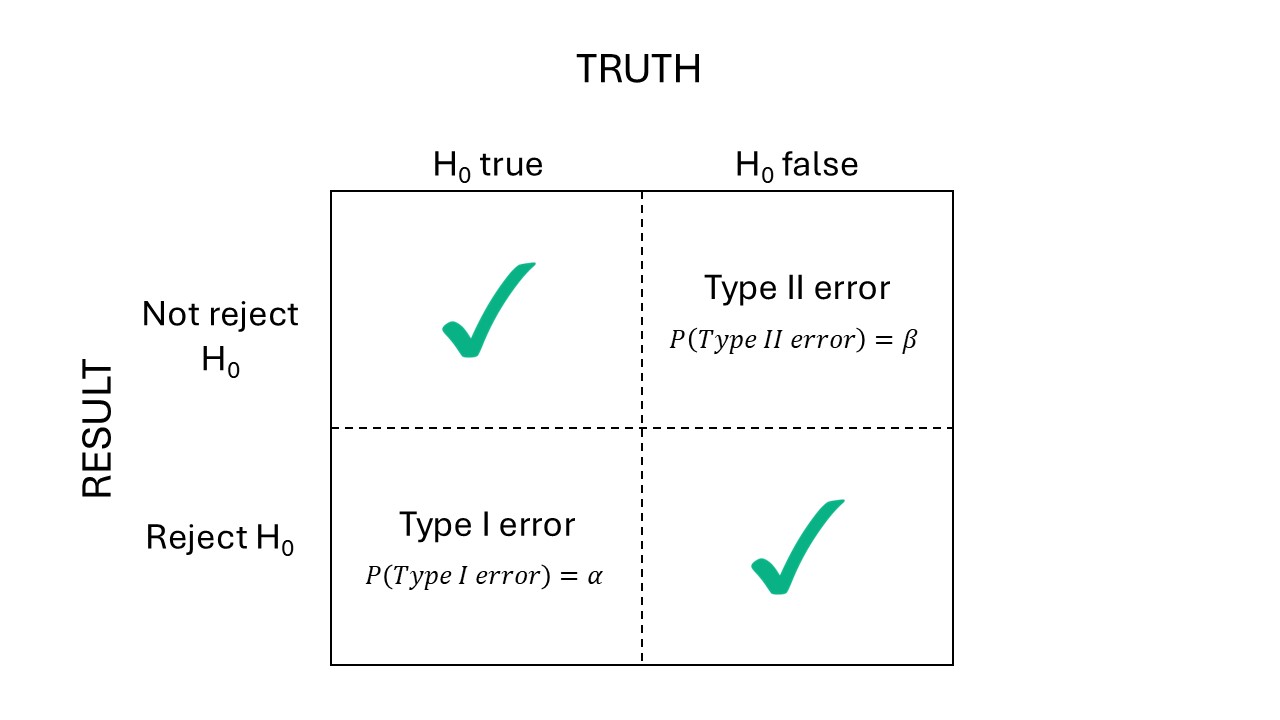
Figure 20.2: Types of error
We normally control \(\alpha\), the probability of doing an error of type I. TO describe our experiment’s ability to detect scientific discoveries, we consider power: the \(P(\text{reject } H_0 | H_0 \text{ false}) = 1- \beta\). Very often, research teams consider 0.8 power as the minimum for an experiment.
20.3.1 Power calculations
t-test
- Used to evaluate differences between treatment effects or means.
- Example testing against zero: \(t^{\star} = \frac{\hat\theta - 0}{s.e.(\hat\theta)} = \frac{\hat\theta - 0}{s.d.(\hat\theta)/\sqrt{n}}\)
- Note the sensibility to sample size.
- Also, remember the \(s.e.(\hat\theta)\) may differ depending on the design:
- \(s.e.(\hat\theta)\) may depend on \(\sigma^2_\varepsilon\) only (e.g., CRD, RCBD, mean comparisons between treatment levels of the treatment at the split-plot level), \(s.e.(\hat\theta) = \sqrt{\frac{2 \sigma^2_{\varepsilon}}{r t}}\).
- \(s.e.(\hat\theta)\) may depend on \(\sigma^2_\varepsilon\) and \(\sigma^2_{whole \ plot}\) (e.g., mean comparisons between treatment levels of the treatment at the whole-plot level), \(s.e.(\hat\theta) = \sqrt{\frac{2 (\sigma^2_{\varepsilon} + b \cdot \sigma^2_w)}{b \cdot r}}\)
To detect a difference \(\delta\): \[n = \frac{2\hat{\sigma}^2}{\delta^2}[t_{\alpha/2, \nu} + t_{\beta, \nu}]^2,\] where:
- \(n\) is the sample size,
- \(\hat\sigma^2\) is the estimate of \(\sigma^2\) based on \(\nu\) degrees of freedom,
- \(\alpha\) is the type I error rate,
- \(\beta\) is the type II error rate,
- And note that: \(Var(\delta)=2\sigma^2/n\).